La tecnica HVSR nasce dalle osservazioni fatte in Giappone sulle stazioni strong motion della rete nazionale. Venne messo in evidenza come le stazioni su terreni soffici subissero una forte modifica sulle componenti orizzontali rispetto alle stazioni posizionate su terreni molto "duri", o sul bedrock.
Nel 1983 Nakamura dimostra come il picco analizzato in una curva HVSR sia fortemente legato alle caratteristiche del suolo. Venne messo in evidenza come tale modifica sul piano orizzontale, non sia completamente legata solo alle onde di Rayleigh, ma anche dalla componente SH delle onde S generate dalla rifrazione della onda P nell'interfaccia bedrock/suolo e nelle interfacce presenti dentro la stratigrafia del suolo stesso.
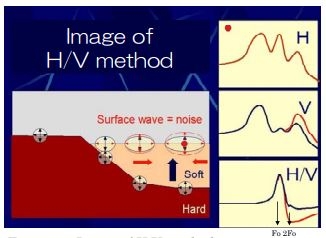 Schema della tecnica HVSR - On the H/V spectrum - Yutaka Nakamura - 2008
Il valore di ampiezza del rapporto H/V permette di valutare il fattore di amplificazione del suolo per le onde SH, mentre il doppio del valore della frequenza di picco, permette di valutare l'effetto delle onde di Rayleigh e/o delle riflessioni multiple delle onde SH (Nakamura - 2008).
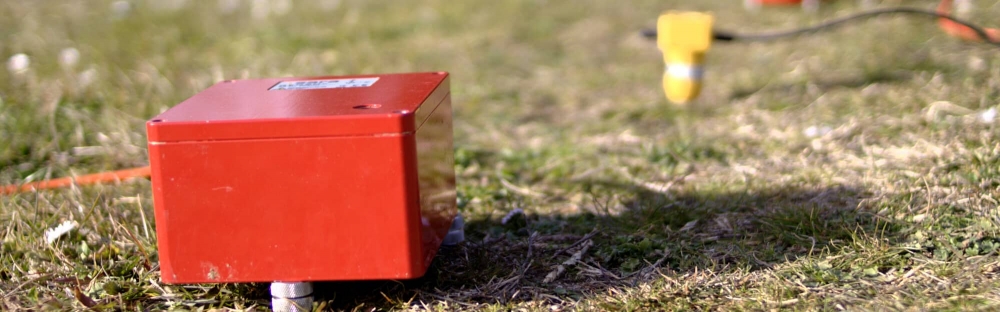
Grazie al nostro strumento GeoBox, nelle varie possibili configurazioni, ed al nostro software GeoExplorer, è possibile registrare, analizzare e modellizare il profilo stratigrafico.